The Active Office recently turned 3 years old, and for its birthday it asked for more data charts! In this blog, Data Systems Technician, Luke Ardolino, takes a quick look at how the Active Office’s energy consumption changed after people started working from home.
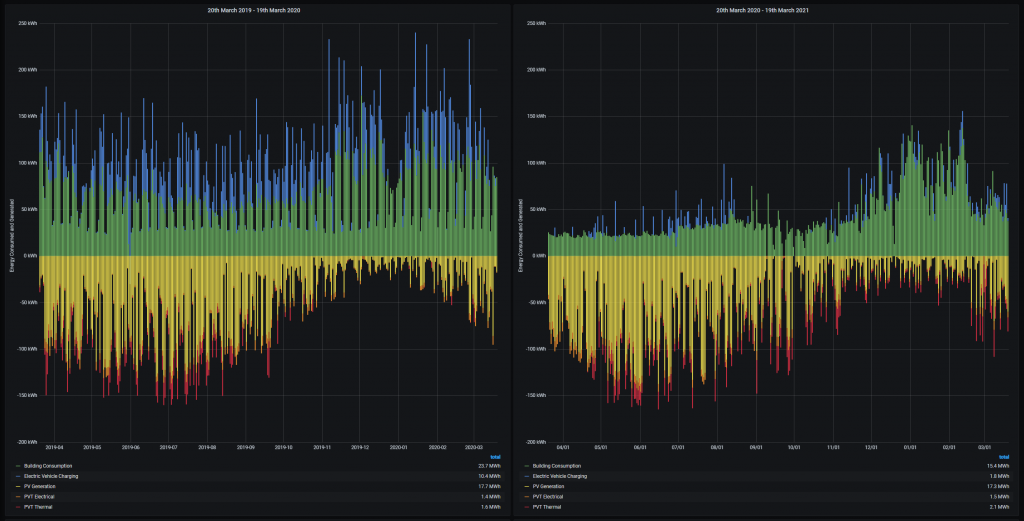
The charts above show the Active Office’s daily energy consumption and generation. The data is broken into 2 charts to separate 12 months prior to, and 12 months after people started working from home.
In the left side chart, you can see a sort of saw tooth effect in the energy consumption where it regularly drops down drastically to around the same level. These are the weekends, where only the essential systems are running as (in theory) no one should be in the office at this time. These dips give us our first view of the base consumption of the Active Office.
We can see the first few months of the right side chart, the Active Office runs completely at this base consumption level, which makes sense because for the most part no one was in the office at this time and so the building was largely dormant.
Taking the base consumption as (very roughly) 25 kWh per day, we can calculate the total base consumption for a year as (again very roughly) 9.1 MWh. In the year prior to working from home this base consumption made up 39% of the total consumption (excluding car charging), and in the year after this the percentage was 60%. Obviously, the energy generation is not impacted by occupancy so the energy generation is similar over the two periods.
Some elements of the base consumptions cannot be changed. For example, a large contributor is data and IT systems themselves, including Wifi access points, sensors and data collection that must run 100% of the time. Switching these off would make a noticeable difference, but then we wouldn’t have any data to look at to see the difference. Early in the design of the building we decided to process and store the majority of data on site to get a good indication of the energy cost for this. Utilising the waste heat generated by these systems is one way we can increase the overall efficiency of the building. This doesn’t mean using a network switch as a seat warmer. In the winter, we extract the heat from the communications room into the heat recovery ventilation system for distribution around the building, however, in the summer cooling is more of a challenge.
As the heating season began we took the opportunity to operate the building heating system in new ways and try out new heating strategies and controls, so the energy consumption as winter began was more representative of an occupied building than earlier in the lockdown period.
Another point of interest in the data is the relative drop off in car charging. The building consumption dropped by 36%, but the car charging dropped by 83%. Again, this makes sense because while working from home people haven’t needed to travel as much, and the majority of the vehicle charging that did take place was for the community support activity around delivery of PPE and hand sanitizer. But the degree to which the charging consumption dropped is surprising to me at least and reiterates what we’re seen in the last year or so. That a lot of our travel was actually quite optional.